With the rise of hybrid work and non-traditional workplace models, leaders in real estate,
facilities, HR and operations need more visibility into how their people are using office spaces,
such as how often their desks have been used in a particular floor or the average length of time
meeting rooms are occupied across their global campuses.
But getting these metrics can be a big challenge when dealing with multiple, siloed data sources
that aren’t designed for occupancy reporting. We’ve decided to make this easier for workplace
experience teams with our Workplace Analytics Dashboard.
Through native reporting features and built-in integrations with the 100+ data sources you
need for occupancy reporting and clean, crisp and intuitive visual dashboards that are easy to
adjust and work with, the Workplace Analytics Dashboard is your all-in-one occupancy
reporting tool. Connect your data sources, including occupancy sensors and workplace
experience apps and discover occupancy trends with historical and geographic comparisons,
without hassle.
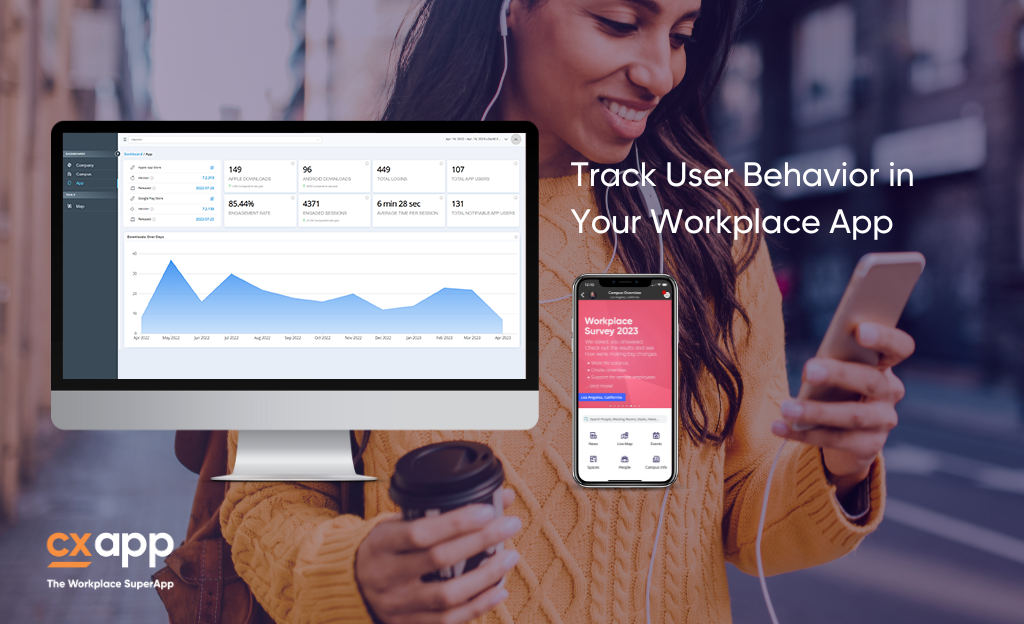
In addition to the benefits offered by our Workplace Analytics Dashboard, helping employees
plan out their day at your offices is a key part of our Workplace SuperAppTM . Just by checking
their workplace app, your hybrid employees can see which desks and rooms on each floor are
open, using an interactive digital map that shows them occupancy in real-time. This allows
them to find and book spaces during their workday at the office or remotely, ahead of time,
giving them ample flexibility when planning their day.
Along with real-time occupancy, our Workplace SuperAppTM allows employees to see where
their colleagues are sitting at your office, so they can join them and work together. With the
help of our step-by-step navigation, team members can easily find one another and collaborate
with ease, encouraging your people to come to the office and be engaged, in-person.
And the best part? How often your employees use each space (frequency), how long they
occupy it on average (recency) and how many people are in a single space at any given time
(density) – all of it can be tracked safely and anonymously through our Workplace Analytics
Dashboard. Through one integrated platform that offers an easy, intuitive user interface for
your employees and a powerful backend that can aggregate occupancy metrics for your
leadership team, you can make smarter decisions about which spaces you’d like to invest in,
redesign and retire.
CXApp’s cross-platform Workplace Analytics Dashboard promotes sustainability by providing
metrics on which spaces are being fully utilized and those that are being underutilized on each
campus. Using this information, companies can cut back on the resources needed to maintain
facilities that are not being used and reduce their overall carbon footprint. Also, they can use
this data to offer sustainable options such as recyclable containers in the areas that have the
highest occupancy rates, in order to encourage eco-friendly habits and behaviors from their
employees.
Our product promotes employee health and wellness by uncovering which in-person and digital
health and wellness tools are getting the most traction at each campus. For example, if a
company has set up a meditation room on a campus, they can see how often and for how long
users have occupied this meditation room, leading to clear insights on whether they should
build more spaces like it or take a different approach to promoting mental health and
relaxation on campus. Likewise, our Workplace Analytics Dashboard can reveal how many times
the meditation course on your workplace experience app has been accessed by employees, so
you can assess whether or not your digital wellness initiatives are truly effective as well.
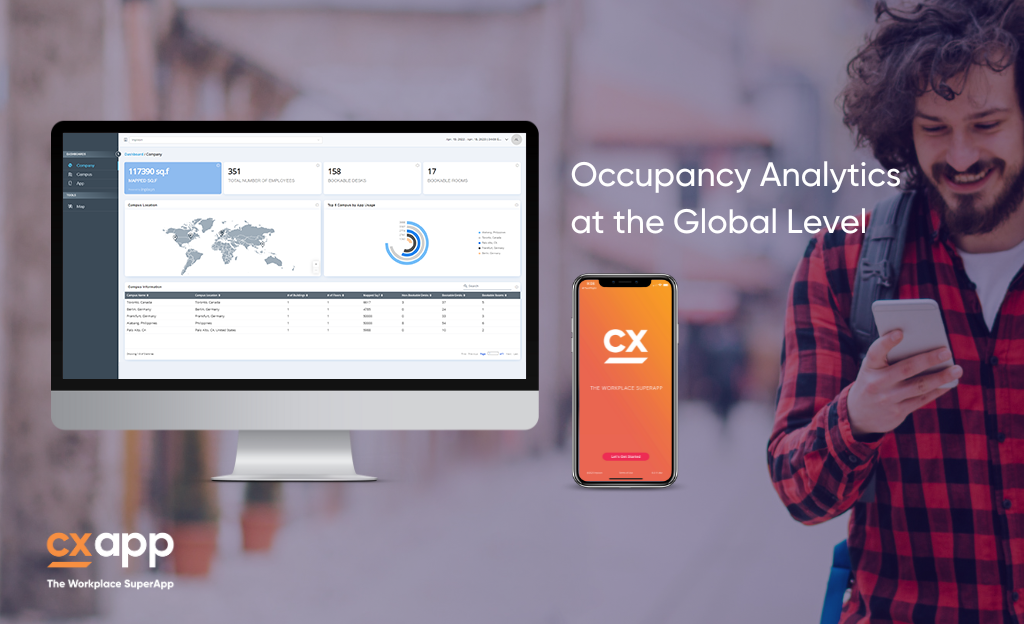
- View Company Data Dashboard: Get global and regional-level occupancy metrics.
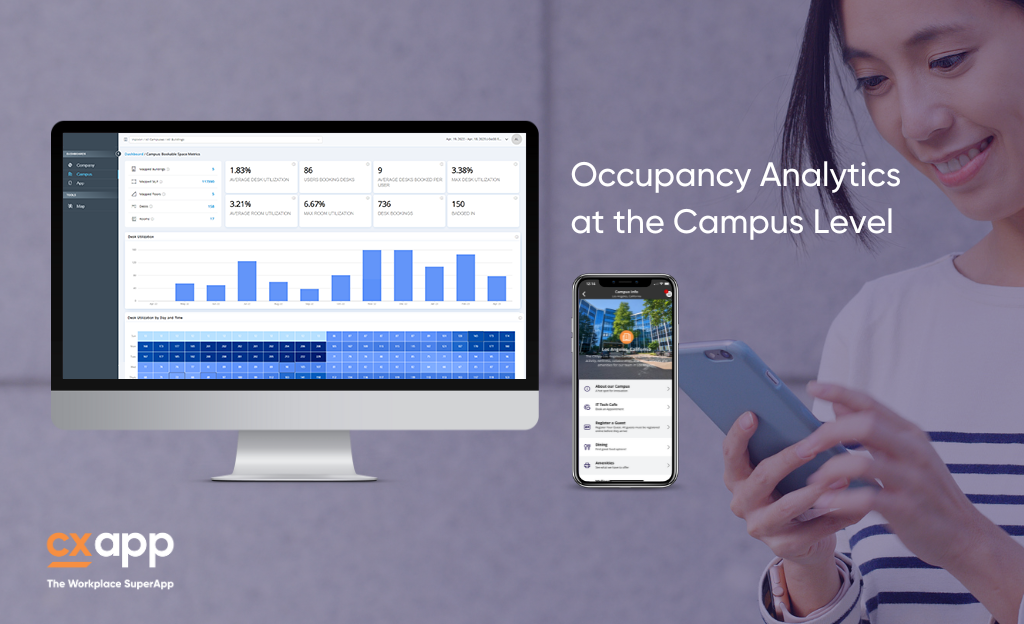
- View Campus Data Dashboard: View occupancy metrics for each campus.
- View App Data Dashboard: Track how employees use your workplace experience app.
- Measure Historical & Geographic Comparisons: Compare how your occupancy and KPI
metrics change based on timeframe and geography. - Measure Recency and Frequency: Measure the recency and frequency of occupancy of
each desk, room, floor and building and more.